| ProfileMap
Ranking Model 2.0 |
1 Table of Contents
4 Feature Generation and Sub-Scores 4
4.4 Project Relevance Sub-Score 5
6 Automatically Generated Data 10
2 Background
The former ranking model was confusing for users due to a lack of comprehensibility of overall and sub-score calculations. Based on the feedback received by users and our internal analyses of the method and the data, five issues of the model were identified that contributed to this situation:
- There was a bug in the model leading to certificates being ignored in the evaluation of a profile.
- The model was largely based on complex ontology patterns not visualized in the side-by-side comparison.
- The sub-scores mostly didn’t represent parts of the overall score calculation but were calculated independently.
- Some samples in the data used for training the model were incorrectly rated leading to occasional incorrect predictions of the model.
- There were blind spots in the data used for training the model. Certain kinds of searches weren’t represented in the data.
To increase the comprehensibility, a new model was designed, implemented, and evaluated that addresses these five issues.
3 Approach
The learning problem remained the same: A machine learning model was trained to predict the star rating that would be given by a human expert for the fit between search request and candidate profile. The resulting prediction is scaled to 0-100%, displayed as the overall score of the profile in the search results list and the side-by-side comparison and used for ordering the candidates in the search results list.
The machine learning algorithm used is a decision tree ensemble (XGBRegressor[1]). To address the aforementioned issues the features and the data set used for training the machine learning model as well as the sub-score calculations were adapted.
To address issues 2 and 3, the sub-score calculations were improved and used as features of the machine learning model instead of the not visualized more complex features of the prior version. The details of the feature generation and sub-score calcuation are described in the section Feature Generation and Sub-Scores.
To address issues 4 and 5, the manually labeled training data was cleaned of incomprehensible samples. Furthermore, additional training samples were automatically generated to cover previously missing parts of the data space and used in combination with the manually labeled data. The manual data set is described in the section Manually Labeled Data. The automatic generation of data is described in the section Automatically Generated Data.
4 Feature Generation and Sub-Scores
The updated version of the machine learning model uses the following seven features:
- Competence Sub-Score
- Project Relevance Sub-Score
- Certificate Sub-Score
- Language Sub-Score
- Competence Fraction
- Certificate Fraction
- Language Fraction
The Fraction features correspond to the fraction of entities in the search request that are of the corresponding entity type. So, if the search request contains 5 competencies, 3 languages and 2 certificates, the Competence Fraction would be 0.5, the Language Fraction 0.3 and the Certificate Fraction 0.2.
The Sub-Score features correspond to the sub scores displayed in the side-by-side comparison, the first three are also displayed in the search results list. They are calculated as described in the following sections.
4.1 Certificate Sub-Score
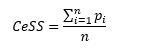
The Certificate Sub-Score CeSS is calculated as the fraction of requested certificates present in the profile:
With being the number of requested certificates and being 1 if certificate i is present in the profile and 0 if not.
So, if two certificates are requested but only one is present in the profile, the Certificate Sub-Score is 50%.
4.2 Competence Sub-Score
The Competence Sub-Score CoSS is considering whether a competence is present in the profile and to what degree the requested competence level is met. It is calculated as:
With bein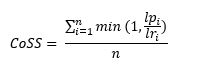 g the number of requested competencies,
 ![]() being the requested competence level of competence i and being the competence level present in the profile with 0 for competencies that are not present in the profile.
being the requested competence level of competence i and being the competence level present in the profile with 0 for competencies that are not present in the profile.![]() is capped at 1. So, candidates will receive the same score whether they match the level exactly or have a higher level than what is requested.
is capped at 1. So, candidates will receive the same score whether they match the level exactly or have a higher level than what is requested.
So, if Java and Python are requested at level 4 and a candidate has Java at level 4 and Python at level 1, then his Competence Sub-Score would be 62.5% (the average of 100% for meeting the requirement for Java and 25% for having level 1 Python when level 4 was requested).
4.3 Language Sub-Score
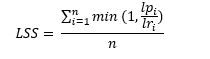
Analogously to the Competence Sub-Score, the Language Sub-Score LSS is considering whether a language is present in the profile and whether the requested language level is met. It is calculated as:
With being the number of requested languages, being the requested language level and being the language level present in the profile with 0 for languages that are not present in the profile. is capped at 1. So, candidates will receive the same score whether they match the level exactly or have a higher level than what is requested.
So, if English and Spanish are requested at level 1, French at level 2 and German at level 4 and a candidate has both French and German at level 2 but not the other languages, then his Language Sub-Score would be 37.5% (the average of 100% for meeting the requirement for French, 50% for having level 2 German when level 4 was requested and twice 0% for not having English and Spanish in the profile).
4.4 Project Relevance Sub-Score
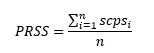
The Project Relevance Sub-Score PRSS is calculated as the average of the single competence project scores of all requested competencies:
With being the number of requested competencies. As shown below, the single competence project scores are calculated taking the requested competence level, the duration, and the recency of a project into consideration.
As defined in the ProfileMap User Manual, the different competence levels correspond, among other things, to different requirements concerning practical experience in projects. At level 1, no project experience is required, at level 2 minimal, while levels 3 and 4 require more extensive practical experience.
| Skilllevel | Description |
| Skilllevel 1 – Basic Knowledge | Employee knows the principles and mechanism and the theory (from training or school) but doesn’t have any practical knowledge. |
| Skilllevel 2 – Limited Expertise | Employee has comprehensive theoretical knowledge and first practical experience. They can work in projects together with a more experienced colleague. |
| Skilllevel 3 – Advanced Expertise | Employee has established theoretical knowledge and already has practical experience from projects. They can lead subprojects or smaller projects in this field. |
| Skilllevel 4 – Expert | Employee has great expertise and has extensive knowledge regarding this skill. They can provide training for others. They can lead any project of any size on their own and can assist customers regarding their questions or problems. |
Table 1: Definition of competence levels as defined in the User Manual as of 31.03.2023.
To reflect these definitions, the single competence project score is always 1 for competences that are requested at level 1 and requires longer and more recent projects for higher requested competence levels.
This means that if only competencies at level 1 are requested the Project Relevance Sub-Score will always be 100%, even if there are no relevant projects shown.
For levels 2 to 4, the single competence project score for competence is calculated as the sum of all single competence single project scores (the score for one specific competence and one specific project ) with a minimum score of 0.5 if at least one project exists where the corresponding competence is present. The result of this is then multiplied by 4 and divided by the requested competence level leading to higher competence levels requiring more project experience to reach the same scps:
![]()
With being the number of projects the competence is tagged in and being the requested competence level of competence . The score is capped at 1.
For example, in case that there is only one project relevant for a certain competence, that has been ongoing for a year, the for this competence would be 1 if the requested competence level was 2, 0.85 if the requested competence level was 3 and 0.64 if the requested competence level was 4.
In accordance with the competence level definitions, with the added 0.5 and the multiplication by the is designed to always produce scores of 1 for a requested competence level of 2 if any project with competence is present.
The single competence single project score for competence i and project j is calculated using the start date and the end date (in years ago from current date) of the project. Thus, both the recency as well as the project length play a role. It is calculated as the area under curve of the following function:
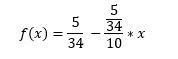
The function was designed for an ongoing project to reach about 0.25 (which is the value required for the to reach 1 for level 3) for a requested competence level of 3 and a project length of about 2 years and to reach about 0.5 (which is the value required for the to reach 1 for level 4) for a requested competence level of 4 and 4 years. In addition to that the was designed to not increase anymore for projects longer ago than 10 years (see Figure 1).
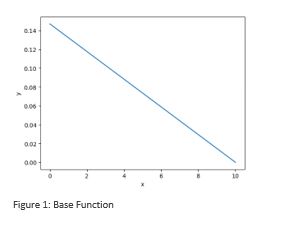
For the calculation of the area under curve the integral was derived. This leads to the following formula for the with and defining the section of interest:
![]()
As shown in Figure 2, the formula values longer time periods higher than shorter ones. Likewise, more recent time periods are valued higher than earlier ones – e.g., for = 2 and = 0 versus = 10 and = 8.
| Competence 1 | Competence 2 | PRSS | ||||
| Requested comp. level | Project start | Project end | Requested comp. level | Project start | Project end | |
| 1 | – | – | 1 | – | – | 100% |
| 2 | – | – | – | – | – | 0% |
| 2 | 10 | 9 | – | – | – | 100% |
| 3 | 10 | 9 | – | – | – | 68% |
| 4 | 10 | 9 | – | – | – | 51% |
| 4 | 10 | 9 | 1 | – | – | 75% |
| 3 | 3 | 2 | 4 | 5 | 3 | 75% |
| 3 | 2 | 1 | 4 | 4 | 2 | 77% |
| 3 | 4 | 2 | 4 | 6 | 3 | 84% |
Table 2: Project Relevance Sub-Scores for different scenarios.
5 Manually Labeled Data
Manually labeled data was collected over a period of three weeks in early 2022 by data annotators that have been instructed on what kind of searches to perform and how to rate profiles by an experienced sourcing manager. The data collection was done using the feedback mechanism in the ProfileMap search. The mechanism allows users to give 1 to 5 stars to a search request / candidate profile pair.
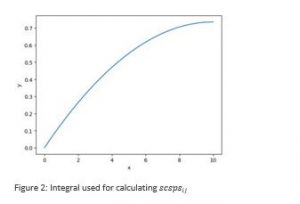
A quality evaluation of the data showed that it included erroneous feedbacks as well as feedbacks that could only be accounted for with complex ontology patterns that aren’t visualizable in the side-by-side comparison. Because of this the initial data set was filtered to ensure only reliable and comprehensible data samples to be included in the training of the updated ranking model. The training data set used included 789 manually labeled profile ratings.
As can be seen in Figure 2, the resulting data set includes mostly rating of 3 or 4 stars.
6 Automatically Generated Data
In the analysis of the training data set used for the previous ranking model, it was discovered that certain kinds of searches were missing. This especially included key word searches for a limited number of entities since the model was originally designed to only analyze complex searches derived from NLP analysis of job descriptions.
In the data science community, approaches to augment manually created datasets with automatically synthesized data have established themselves as an effective way to counteract situations like this and to improve the generalization abilities of machine learning models in general[2]. To improve the coverage of the data space and provide the model with a reliable baseline a data augmentation mechanism based on the sub-score calculations described above was designed.
In this approach, first a request and a profile are created focusing especially on scenarios covering edge cases and cases that are underrepresented in the manually labeled dataset. Then the features also used for the machine learning model are calculated:
- Competence Sub-Score CoSS
- Project Relevance Sub-Score PRSS
- Certificate Sub-Score CeSS
- Language Sub-Score LSS
- Competence Fraction CoF
- Certificate Fraction CeF
- Language Fraction LF
Since both scores refer to competencies, the Competence Sub-Score and the Project Relevance Sub-Score are averaged to the Combined Competence Score CCS:
![]()
Finally, the sub-scores for languages, certificates and competences are combined, weighted by the corresponding fraction values (thus valuing each entity type the same), to calculate the overall score OS for the automatically generated training samples:

| Request | Candidate | OS | |||||
| Certificate | Language Level | Competence Level | Certificate Match | Language Level | Competence Level | Project End/Start | |
| Yes | 1 | 1 | Yes | 1 | 1 | – | 100% |
| Yes | 2 | 2 | Yes | 2 | 2 | – | 83% |
| Yes | 3 | 3 | Yes | 3 | 3 | – | 83% |
| Yes | 3 | 3 | Yes | 3 | 3 | 0/1 | 85% |
| Yes | 3 | 3 | No | 3 | 3 | 0/1 | 64% |
| Yes | 3 | 3 | Yes | – | 3 | 0/1 | 64% |
| Yes | 3 | 3 | Yes | – | 3 | 0/2 | 67% |
| Yes | 3 | 4 | Yes | – | 3 | 0/2 | 59% |
| Yes | 4 | 4 | No | 1 | 2 | 1/3 | 29% |
Table 3: Example requests (with at most 1 certificate, 1 language and 1 competence) and candidates with their generated overall score.
Using this method, 3221 data samples were generated to create a total dataset of 4000 samples that are equally distributed over all five star ratings.
7 Evaluation
800 of the samples (20%) were randomly selected to serve as evaluation dataset. The model was then trained and its hyperparameters tuned using 5-fold cross validation on the remaining 3200 data samples. Using the best determined parameter combination, the model was then evaluated on the evaluation dataset.
The evaluation was done considering the R² score, commonly used to evaluate search rankings, as well as the root-mean-square error. The results of the evaluation can be seen in the table below:
| Metric | Result |
| R² | 0.99414 |
| RMSE | 0.01959 |
Table 4: Evaluation results.
As can be seen, the model very reliably predicts the samples in the evaluation dataset.
The web service the model was integrated into is validated using unit and integration tests to ensure the observed quality of the ranking is correctly transferred to ProfileMap’s search.
8 Outlook
We do see value in further improving the ranking approach in the future e. g. with extensions like the following:
- Using more complex competence and job role relationship patterns as features in the model.
- Using the information about which industry a request is focusing on as a feature in the model. Language competences, certificates, and project experience might e. g. be differently relevant whether one searches in the IT, legal, or tourist industry.
- Letting the model learn how to value different project recency and duration patterns.
- Using user preferences, focus areas, education, or location as features in the model.
- Re-training the model using additional manually labeled data.
Further adaptations of the model will, however, always be presented, discussed, and approved by our user base first. In addition to that, changes to the set of used features will always be accompanied by additions to the side-by-side comparison visualizing and / or explaining the added features.
9 Change History
| Version | Chapter | Description | Author | Date |
| 0.1 | All | Initial Draft | Philipp Blohm | 31.03.2023 |
| 0.2 | Outlook | Clarification about searches in different industries | Philipp Blohm | 03.04.2023 |
| 0.3 | Feature Generation and Sub-Scores | Correction of formulas (‘min’ instead of ‘max’), more detailed explanation of the calculation of the project relevance sub-score | Stefan Menke | 17.04.2023 |
[1] For a detailed description see Introduction to Boosted Trees — xgboost 1.7.5 documentation as of 31.03.2023.
[2] See e. g. [1808.02455] Data augmentation using synthetic data for time series classification with deep residual networks (arxiv.org), [1612.07828] Learning from Simulated and Unsupervised Images through Adversarial Training (arxiv.org) as of 31.03.2023.